NotebookLM for beginners: turn a lesson into a reviewed infographic
A half-full tank should not overflow. Yet that was exactly what our first NotebookLM infographic implied. The numbers were right; the picture told a different story.
In this guide, you turn one lesson source into an image that helps explain a relationship. Then you compare the image with the original, request a new version if needed, and download a PNG. Reviewed means compared with the source, not guaranteed to be correct.
This guide is for adults studying or creating training material. Allow roughly 15–20 minutes of your own work, plus generation time. We cover one infographic, not presentations, audio summaries, or a tour of everything in NotebookLM.
Open NotebookLM and check access
Go to NotebookLM on your computer and sign in with your Google Account. Google's current Help pages use the name Gemini Notebook. We retain NotebookLM here so that this guide is easy to find alongside our earlier tutorials.
You need editing access to the notebook. Organization settings can affect work and school accounts. Google's infographic-specific Help page says the feature is for users over 18, while its style section says 18+. Do not assume that every student, or everyone who has just turned 18, is eligible. Check what your account actually offers.
Source: Google: account requirements and access.
If this is your first notebook, our NotebookLM guide to sources and study help explains the basics. You do not need code or an API key for the browser steps below.
1. Add one lesson source
Create a new notebook. Choose to add a source and paste text. Give it a clear name, such as "Rainwater tank." Use only this source for the exercise, so the picture does not mix in other lessons.
Copy our original fictional learning example:
A roof directs rainwater through a leaf filter into a storage tank. The tank holds 200 litres. Before rain, it contains 40 litres. During the exercise, 60 litres reach the tank after filtering. Nobody uses water during the rain. Afterwards, the tank contains 100 litres: 40 + 60 = 100. It is half full, with 100 out of 200 litres stored. An overflow outlet sends excess water away only when the tank is full. The stored water is used for plants, not for drinking. The exercise does not specify roof area, rainfall depth, or filter efficiency.
Read the saved source. The question your image should explain is: what changes after rain, and what stays the same? The amount stored increases. Capacity remains 200 litres.
If you use your own course material, make sure you have permission to use it in the service.
Source: Google: add sources.
2. Customize the infographic before generating
Open Studio and find Infographic. The pencil icon lets you customize the image before generation. Choose English, landscape orientation, and Concise detail. Exact labels can vary between languages and accounts.
Add instructions that keep the picture close to the lesson:
Make a concise infographic from this lesson source. Show the route from roof through leaf filter to tank, the amount after rain, and later use for plants. Keep the 200-litre capacity distinct from the 100 litres stored. Include 40 + 60 = 100 litres and half full. Label it as a fictional learning example. Do not add roof area, rainfall depth, or filter efficiency.
Start generation. It continues in the background. Once its title appears in Studio, open the image and zoom into its text and details. If the feature is missing, check account eligibility before planning the exercise.
Source: Google: generate and customize an infographic.
3. Check the numbers and what the picture implies
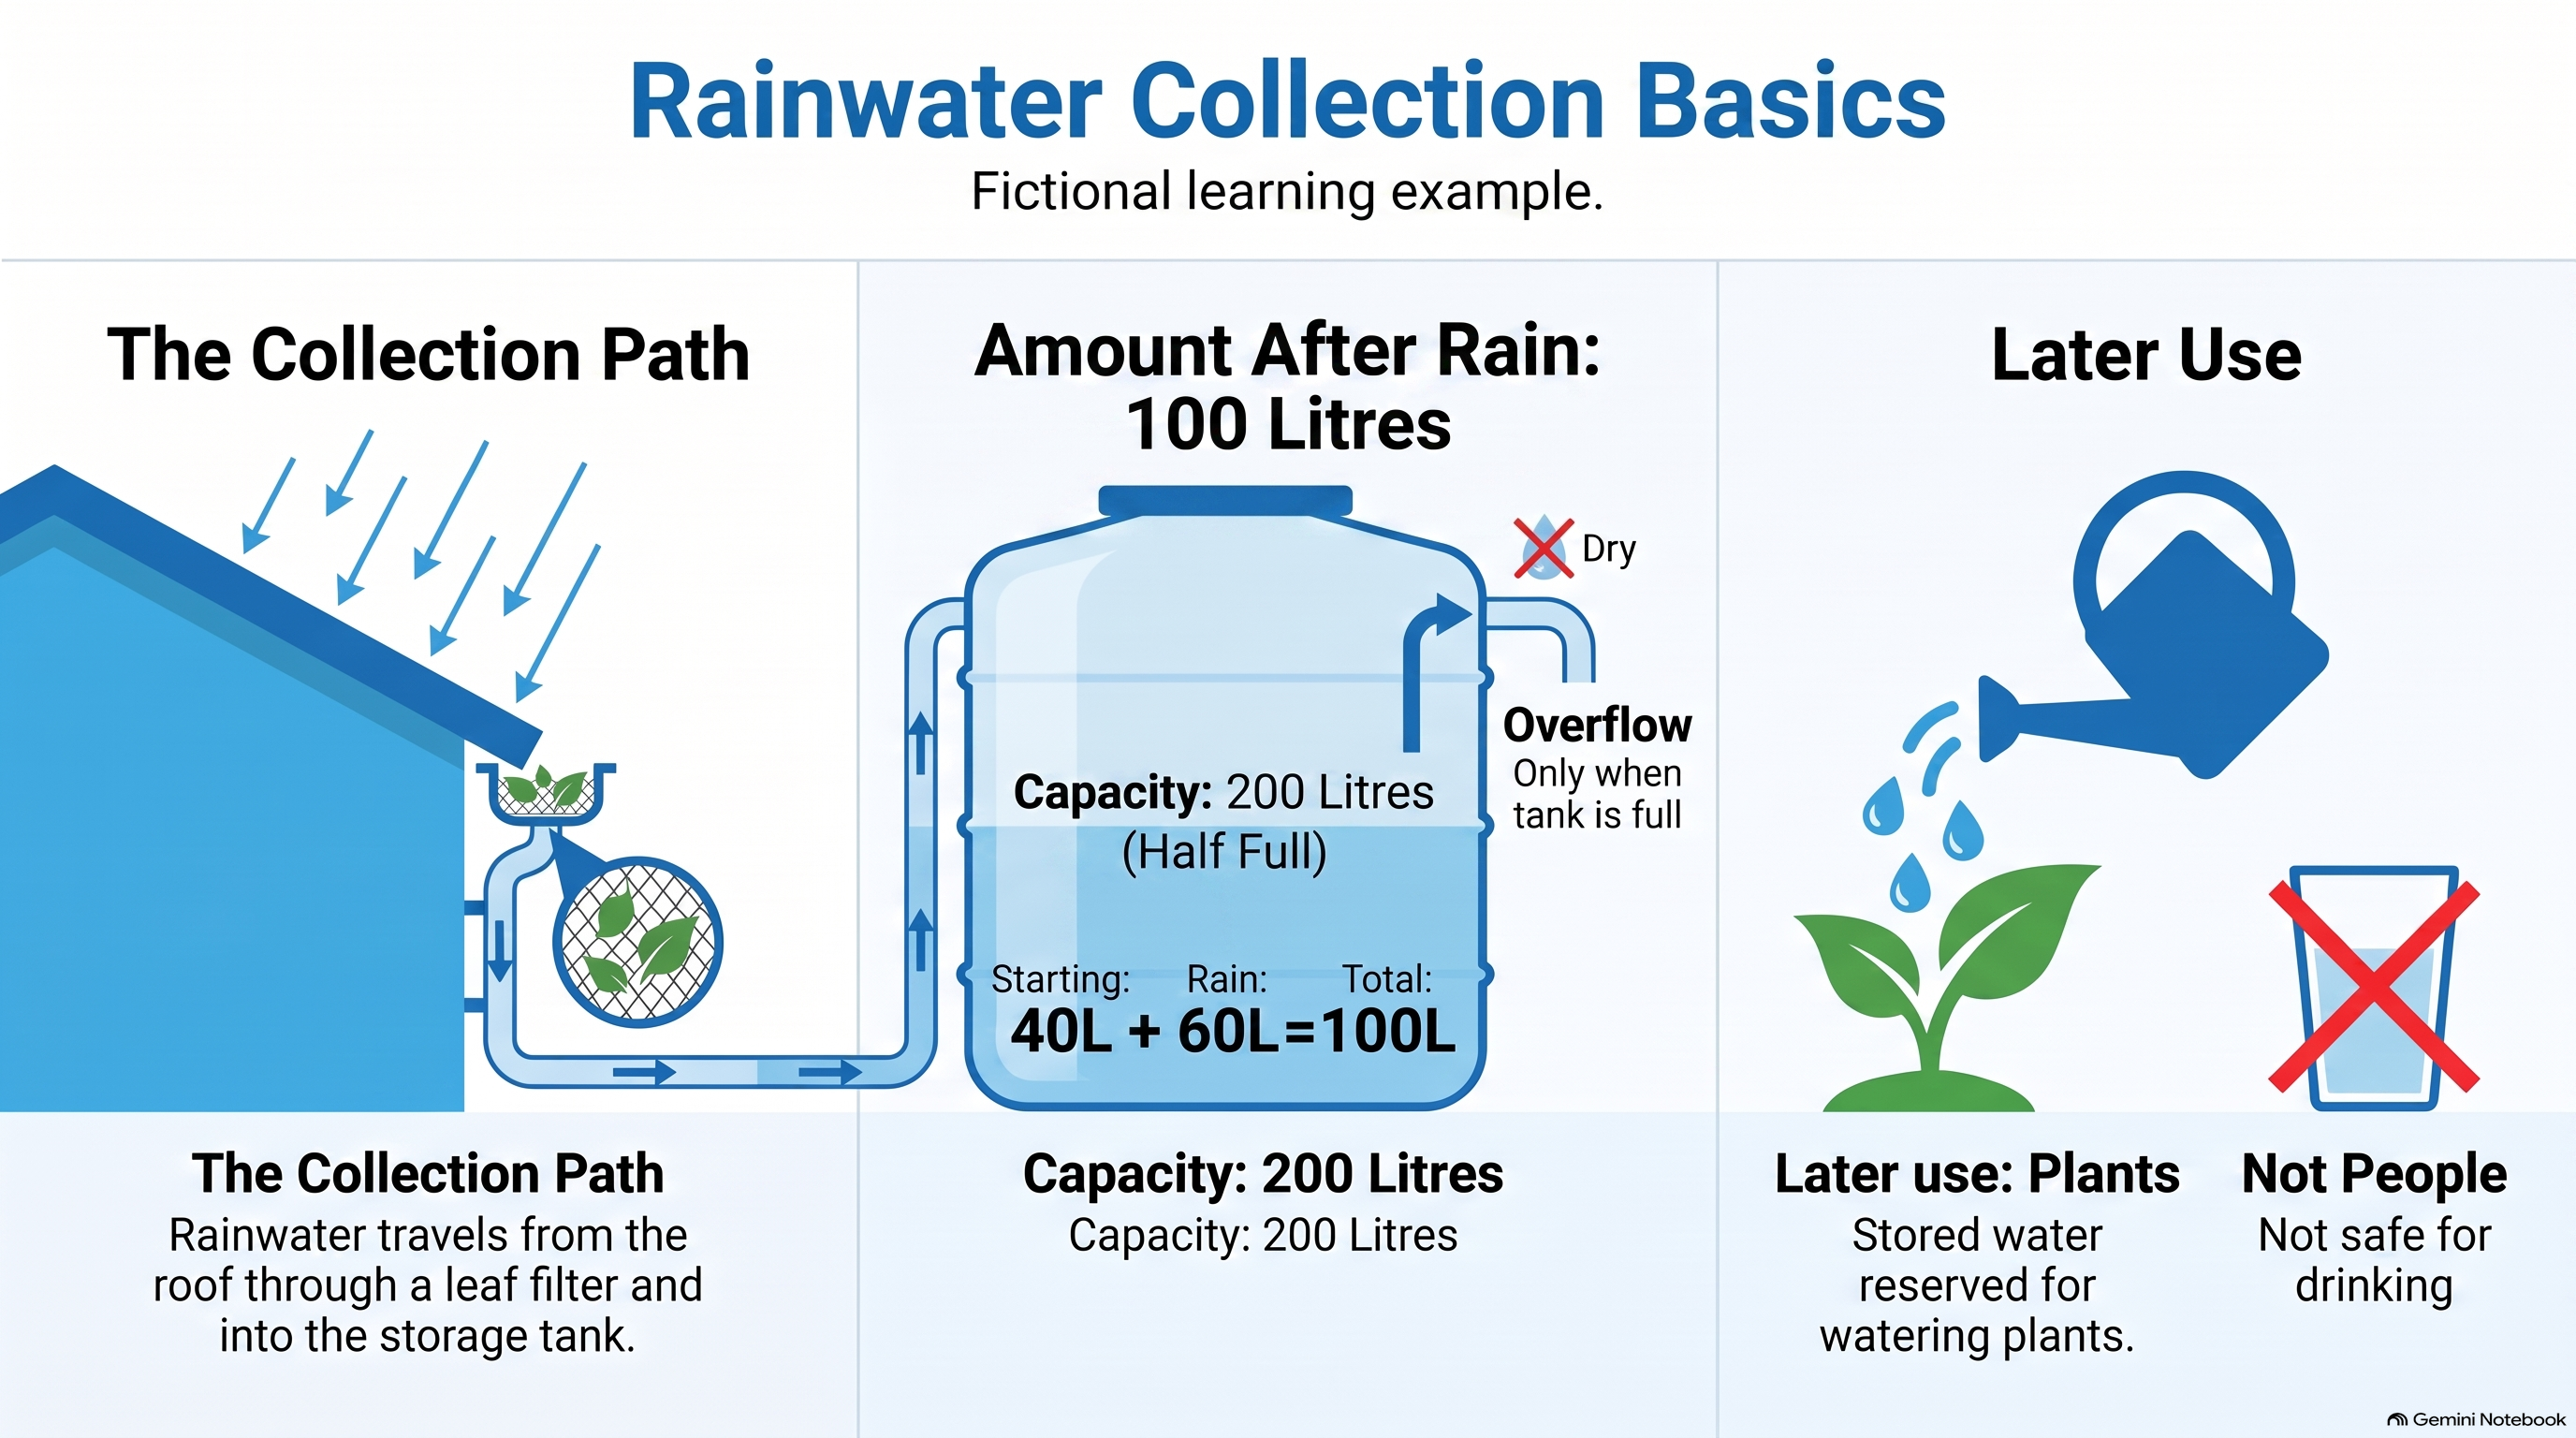
Actual English NotebookLM result. This is a review example, not an approved design. Its drinking-water wording is stronger than the source's description of intended use.
Start with the numbers: 40 litres plus 60 litres should make 100 litres. Then compare the water level with the 200-litre capacity. A clear label helps, but also check whether the drawing gives a reasonable impression of the proportions.
Next, inspect arrows, droplets, and event order. Our first English result showed droplets at the overflow even though the tank was half full. The picture implied a flow that the source did not support. Watering also needed to be separated from the rainfall calculation.
Finally, read the claims. The English regeneration says "Not safe for drinking." Our Swedish generation similarly states that the water must not be used as drinking water. The source describes intended use; it does not assess water quality. That distinction needs attention before the image becomes teaching material.
Google explicitly warns about visual and factual inaccuracies. A polished image does not replace this comparison.
4. Request a new version with a focused correction
Generate a new image with the previous instructions and add what needs to change. This does not promise direct pixel editing in the existing image.
Show no water leaving the overflow while the tank is half full. State that it is used only when the tank is full. Put watering in a separate Later use panel. Describe use for plants without adding a water-quality claim.
Our English regeneration made the overflow dry and placed watering in a separate panel. However, repeated capacity labels and stronger-than-source drinking wording remained. The Swedish generation also retained stronger wording despite the instructions. Requesting a change is not proof that it happened.
Decide whether to regenerate again or leave the image unused. For this example, we would correct that wording before treating it as finished teaching material.
5. Download and use the image to explain
Once the result suits your purpose, use the three-dot menu or Download in the viewer to download the PNG. Open the saved file, read it at the size you intend to use, and retain the service's provenance mark. Keep the lesson source beside the image.
Then explain the relationship without reading from the page: why did the tank become half full, and why should no water leave the overflow? If the image helps you answer, it has a useful role. If the question needs more reasoning, try our guide to a source-backed answer for a difficult lesson.
Want to use AI visuals in training? Hammer Automation can help your team build source checks into the workflow.
Method: We generated and downloaded the examples through an already-authorized third-party NotebookLM CLI. Browser steps were checked against Google's current Help pages, not a fresh signed-in browser session. The service did not expose an exact model name. The cover is a separate illustration, not NotebookLM evidence.
FAQ
Can I download the infographic?
Yes. Google documents PNG download through the three-dot menu or Download in the expanded viewer.
Is the image automatically fact-checked?
No. Compare numbers, labels, and arrows with the original. Google warns about visual and factual inaccuracies.
Can every student use this feature?
Google’s infographic Help says over 18, while the style section says 18+. Check account availability and organization settings; this guide does not promise access to every student.
The Forge newsletter
Get new articles in your inbox
Pick the topics you care about. No noise, at most one email a week.
We follow GDPR. Unsubscribe anytime.